R, for Open Source Data Goodness
After I left The MathWorks, I stopped being able to afford MATLAB for stats, and switched to the open source R. Recently, there have been a few articles on how R is being used at companies like Google and Facebook (here and here). I thought I'd post some names of books and sites to help out those new to R.

Some books:
- Data Manipulation with R, by Phil Spector. One of the new Springer R series, and note that these books aren't cheap. This could be twice as long as it is, and I found a lot of the meat is towards the end. But still a good book to have. The power of R is that it's a programmable environment, allowing you to do data transformations on the fly, as well as automating your tests/displays/operations. You have to know how to move stuff around.
- Lattice: Multivariate Data Visualization with R, by Deepan Sarkar. Lattice is a very powerful visualization library, highly recommended. This is The Book, another Springer one.
- Interactive and Dynamic Graphics for Data Analysis With R and GGobi, by Dianne Cook and Deborah Swayne. You can check out the GGobi site for flavor. I will have to admit that while my initial forays into using it have been enticing, the UI has some learning curve, and I've backed off a bit and not gone in very far yet. YMMV.
- Statistics: An Introduction Using R, by Michael Crawley. This is an excellent book; it has intro stuff and is very deep on the stats, in terms of application and big picture. Obviously all examples use R, so you can replicate anything you want. The almost artistic side of statistical modeling really comes through here. Don't be fooled by "introduction," though - it's not light and easy reading.
- Introductory Statistics with R, by Peter Dalgaard. I think this is more basic than the one by Crawley. Or just not as deep. I don't look at it as much-- mainly for contrast.
- A Handbook of Statistical Analyses Using R, by Brian Everitt and Torsten Hothorn. A heavy-duty guide with applications of different methods for different types of questions and data sets, including (e.g.) survival analysis, recursive partitioning, multidimensional scaling, longitudinal analysis. A good purchase.
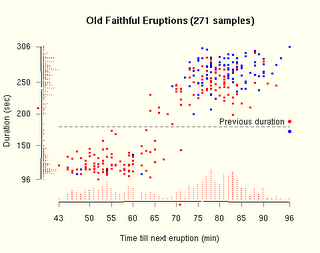
- R Graphics, by Paul Murrell. This is not my favorite book. You can customize anything in an R graph, but it's nasty and difficult to do so. The book doesn't make it easy, and neither did the course I took online from statistics.com from the author. Still, this could be kept around for extreme need. Some of the chapters and source code live here on his site. I think you're better off getting Lattice, which is slightly higher level; and if you must get very pretty output, get the numbers or basic shapes out and use another tool like Excel or Illustrator. Except this guy Steven Murdoch had some real success in his Tufte experiment with R, shown below:

Some tools and helpful sites:
- Quick-R, a great site for getting started, and getting readable nice overviews of different techniques. Lots of pointers and basic help for stuff like graph customization.
- Togaware's Rattle GUI - a timesaver for a bunch of basic and advanced descriptive stats.
- I use SciViews as my R UI, because it has a variable browser and a script area. Some people like Tinn-R. I haven't checked out the emacs client for R yet but intend to.
- There is an R Python interface. Haven't used it, but it makes me happy. (Other languages are supported too.)
- Since R is open source, most of the useful help lies in mailing list threads. There are a few R-specific search engines, including Dan Goldstein's and others listed here on Jonathan Baron's page.
- A nice list of R "tips" lives here.
Labels: infovis

0 Comments:
Post a Comment
<< Home